Real Estate Prices and Unreported Inflation
span> I bumped into one of my neighbors at Starbucks today while getting my daily dose of Starbucks $7 latte (Because nothing says ‘fiscal responsibility’ like drinking a mortgage payment in liquid form./span>)span>. She and I started chatting about the Vancouver real estate market, and how expensive it is, and how she wished she bought 5 years ago./span>
We both laughed, knowing full well that even 5 years ago, she would have still said the same thing.
I usually resist the urge to point out economic data to friendly neighbours, but then my overpriced caffeine indulgence kicked in and I said.span>: “look if I could show you 2 graphs that could show you a long term trend of what really is happening, would it be helpful?” br> br> She agreed and tucked in her $200 yoga mat under her arm for what would be a long sermon. /span>br>span>br>The problem is, if you don’t at least have an inkling about these historic changes you have absolutely no chance of understanding what’s been happening, and more importantly, what’s going to happen – until it hits you right between your eyes financially. /span>
span> So what does historic change look like anyway?br> br> There has been a lot in the last 40, 30, 20 years, but what took my breath was what happened in the past 10 months.br> br>Let’s look at the 2 charts: 1) one about a historical change just 10 months ago and 2) one that started in the 1980s (cue the 80s music and bring my fake mullet please)./span>br>
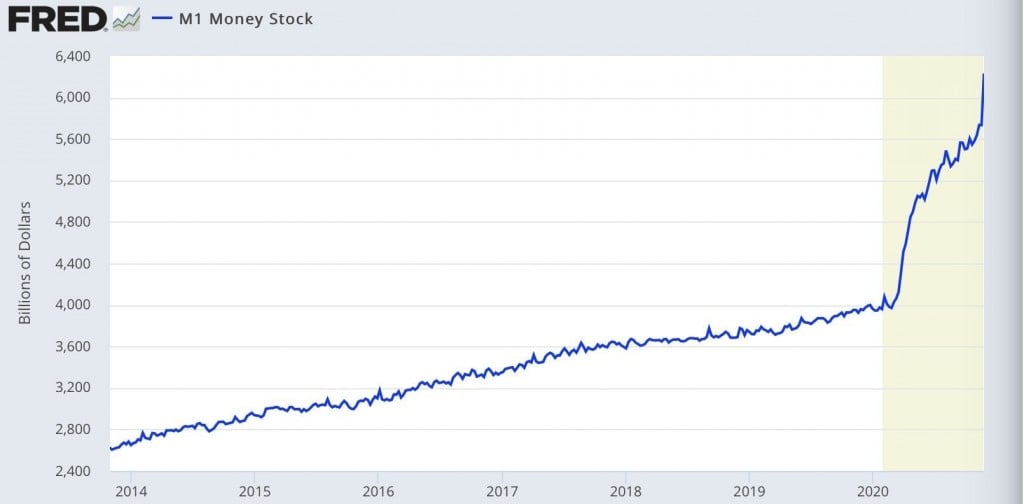
1) Chart 1 – Money Supply
br> span>For instance, how about the bat crazy fact that central banks have printed 35% of all US dollars in existence in the past 10 months:br> br> /span>

span>If that 35% increase in money supply figure seems surreal and makes you question the very nature of reality and the universe, congratulations you and I are not so different after all. That with the fact that Elon Musk is an alien makes me think we’ve crossed over to a new parallel universe.br> br> Our governments have now proven that money CAN grow on trees – or at least that THEY can grow it like its from a tree. br> br> Do you see that on your social feed? Do you see it in the news? I mean that should be front page news.br> br> What Headline do you write such a monstrosity of news?br> br> “Extra Extra! Kids usually ask Santa for presents and grown ups get to pay for it on Christmas. But this year, grown ups get the presents while our kids will have to pay for it!”br> /span>

span>br> br> In all seriousness, what does it mean when you print that much money? But more specifically, what does it mean for hard assets and real estate prices?br> br> Well if we look for the guidance from Milton Friedman (you know the economist known for the 1976 Nobel Memorial Prize), he specifically mentions “inflation is primarily a monetary phenomena.“br> br> br>By the way, I don’t /span>claim to know this knowledge because I am some kind of savantspan>. What I do well is to connect the dots. I read and study research from the past effervescent stars that have a proven track record – and I have implemented their principles for the last 20 years – which also helped with my track record./span>
span>br> br> So back to Milton Friedman. What does he means by – “inflation is primarily a monetary phenomena?”br> br> In a nutshell. pertaining to real estate (and other hard assets): the more money you print, the more it will inflate hard assets – including real estate.br> br> That’s basically it for real estate purposes. Simple.br> br>Those of you who have been following along for the past 20 years know that I have been hitting the same note over and over. We have had unreported inflation for decades (read 40 years) and our governments have been printing money like mad for 40 years. This is one of the main reasons why prices have elongated so much. br> br> But now we have the MOTHER LOAD of all money printing – in 10 months.br> br> That’s HISTORICAL.br> br> “But Richard inflation is at 2%, isn’t it?”/span>br>
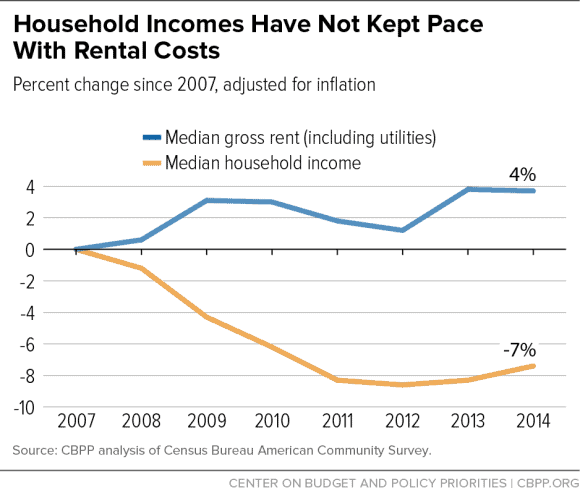
The Bank of Canada and Statistics Canada report an inflation rate of around 3-4%, however, some individuals are worried that the official statistics are not capturing the higher cost of living during the pandemic.
This could mean that the inflation rate is being underestimated. Inflation can have a damaging effect on purchasing power, and can also lead to wage and price inflation, scarcity, and profiteering. There is no definite proof of unreported inflation in Canada, but there are still worries about the accuracy of the official figures.
2) Historical Chart #2 Inflation is NOT 2% – it’s 8% .
br> span> Ah, I am glad you asked. And that brings me to chart number 2./span>br>br>Update:: During 2022 and 2025 we have experienced much higher levels then 8%
INFLATION STATS COMPARING THE BASKET PRE 1980 TO TODAY…TELLS ALL
As of November 12, Governments says we are at 2% or so…using a basket used pre 1980 we are actually closer to 8%!
span>br>The BLUE line is if they had kept the calculation as inflation was calculated in the 1980s (you know with items that actually impact our living costs). The RED line is the newly reformed calculations that exclude a lot of the things that represent our true cost of living./span>
span> In a nutshell, governments suppressed how inflation is calculated in 1980s. In fact, US and Canadian governments depressed reported inflation, moving the concept of the CPI away from being a measure of the cost of living needed to maintain a constant standard of living. /span>
Here are some items that were excluded: The costs of fruits & vegetables, gasoline, fuel oil, natural gas, intercity transportation, and mortgage interest, as well as all indirect taxes (gst/pst) (you know, all the things we need to live).
Also they allowed for cheaper substitutes: Allowing substitution of lower-priced and lower-quality goods in the basket (i.e. more hamburger when steak prices rise) lowers the reported rate of inflation versus the fixed-basket measure.
I don’t know about you but I don’t think a burger is a substitute for a steak.br>But our governments think so.
If you find yourself struggling to keep up with costs vs your salary levels – know you know why. The inflation is understated, while costs keep rising due to an increase in monetary supply.
span>br> br> You can read more about it on Shadow Stats website, but essentially what I am trying to say is that we live in one of the most unreported hyper-inflationary eras of all time.br> br> Our ACTUAL inflation rate according the the way it used to be calculated has been hovering around 8% per annum ever since the year 2000.br> br> From the Shadow Stats website “Consumer Price Index has been reconfigured since early-1980s so as to understate inflation versus common experience. Politicians forced significant underreporting of official inflation, so as to cut annual cost-of-living adjustments to Salaries, Social Security, Retirements Benefits, Private Income…. etc“br> source: Shadow Statsbr> br> br> So according to our stats at strawhomes.com, the average home price in Vancouver top areas in 2000 was about $800,000. If you add 8% inflation rate each year until 2020, you get approximately what we have today. /span>br>
It is HYPER inflation to go from $200,000 to 1.8 million in 20 years. Its not that we get hyper inflation, we have been in one. It is just a matter of the time frame…Look at the percentages increases below.
It is like the frog in boiling water…He doesn’t notice he is in it. Here is a chart – for fun:
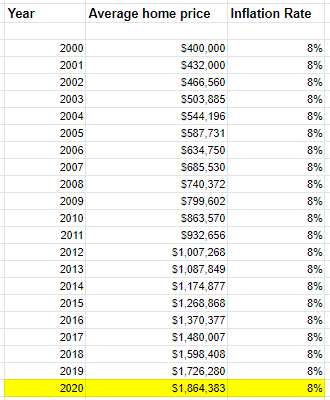
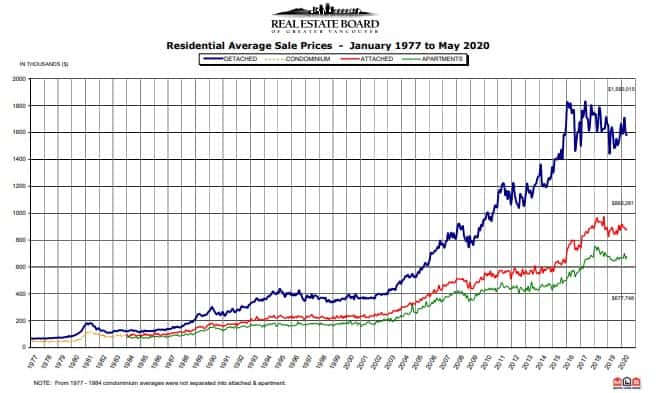
span>br>If you multiply 8% per annum from 2000 until 2020, you get precisely where the Vancouver real estate average price is today – approximately $1.8Million. And there are still those who believe we are in a bubble. br> br> And if we look at a price graph of Vancouver we can see the inflation action right along the same lines!br> /span>
span>br>Main Point: You must protect your money against inflation – its real and it will get stronger with this mother of all money printing. The world is uncertain right now. I don’t have a crystal ball for short term- what I do know in the past are the clear effects of the monetary printing phenomena that inflation has on real estate prices.br> br>Now given what we know from the past inflationary periods, what do you think could happen to hard assets next (now that they have printed 35% of the worlds US dollars in the last 10 months)? I know where my money will be parked – in real estate./span>br> br> Now let’s look at that money supply chart again – zoom in on that last part on the right to see the exponential uptick.
span>This it the time!/span>
span>If would you like to develop a plan to put into ACTION for 2021, REPLY to this message and let’s have a chat! br>/span>
Did you know that real estate prices in Vancouver have increased by 8% on average year after year due to unreported inflation? This steady rise has created significant challenges for potential homebuyers, pushing many to the brink of affordability. Furthermore, the impact of covid19 on real estate has exacerbated these issues, as remote work has prompted a surge in demand for properties in previously overlooked areas. As a result, not only are urban centers like Vancouver seeing price increases, but the entire market landscape is shifting in unexpected ways.
span>br> If you have been waiting on the sidelines, its a good time to make a move! We certainly have been doing so ourselves. 👉 👉 Call me: 604-767-3703.br> br> Cheers, Richard Morrison 🙂/span>br>
Can I help inspire you to achieve your real estate goals?
Making real estate work for you can be simpler than you may think. With a few strategies that I have developed over 20 years, you can get the results you want. I’ve summed up the research in a 17-page ebook. Put your email in the form and I’ll send it to you.
You’ll also receive updates on new articles, books and other things I’m working on. You can opt out at any time. See my privacy policy.
Sources:br>https://www.bankofcanada.ca/2020/08/perceived-inflation-reality-understanding-the-difference/br>https://www.shadowstats.com/inflation_calculator

Let's Chat! Looking for a REALTOR® who can exceed your expectations? Look no further than Richard Morrison! His mission is to serve without limit & provide solutions that cater to your core needs.
• 20+ Years of Experience
• Medallion Member
• RE/MAX Hall of Fame
Latest Properties Added
| Property | Size | Price | Date Listed |
|---|---|---|---|
| 990 Leyland Street, West Vancouver | 3,777 sqft | $3,295,000 | Jul 20, 2026 |
| 6871 Dunnedin Street, Burnaby | 4,082 sqft | $3,188,000 | Jul 20, 2026 |
| 808-68 Smithe Street, Vancouver | 930 sqft | $998,000 | Jul 20, 2026 |
| 1408-2135 Springer Avenue, Burnaby | 764 sqft | $910,000 | Jul 20, 2026 |
| 104-2181 Panorama Drive, North Vancouver | 933 sqft | $599,000 | Jul 20, 2026 |
| 196 58th Avenue, Vancouver | 2,080 sqft | $1,749,000 | Jul 20, 2026 |
| 503-2411 Heather Street, Vancouver | 992 sqft | $1,139,000 | Jul 20, 2026 |
| 6462 Nanaimo Street, Vancouver | 3,357 sqft | $2,180,000 | Jul 20, 2026 |
| 7132 Paulus Court, Burnaby | 2,456 sqft | $2,098,000 | Jul 20, 2026 |
| 8232 Brynlor Drive, Burnaby | 4,400 sqft | $2,099,000 | Jul 20, 2026 |
| 1-4634 15th Avenue, West Vancouver | 1,511 sqft | $2,199,000 | Jul 20, 2026 |
| 210-175 10th Street, North Vancouver | 675 sqft | $599,000 | Jul 20, 2026 |
Start your search with Richard Morrison, Top Award Winning Vancouver Realtor
Contact Richard Morrison Top Vancouver Realtor today to find a Vancouver houses for sale and Vancouver condos for sale. Also check out Burnaby houses for sale or maybe Burnaby condos for sale. If you prefer North Shore, take a look at our listings in North Vancouver houses for sale and North Vancouver condos for sale.